

- Current Usage
- Deliverability
- Volume by IP Address, Sender ID, and Sender Domain
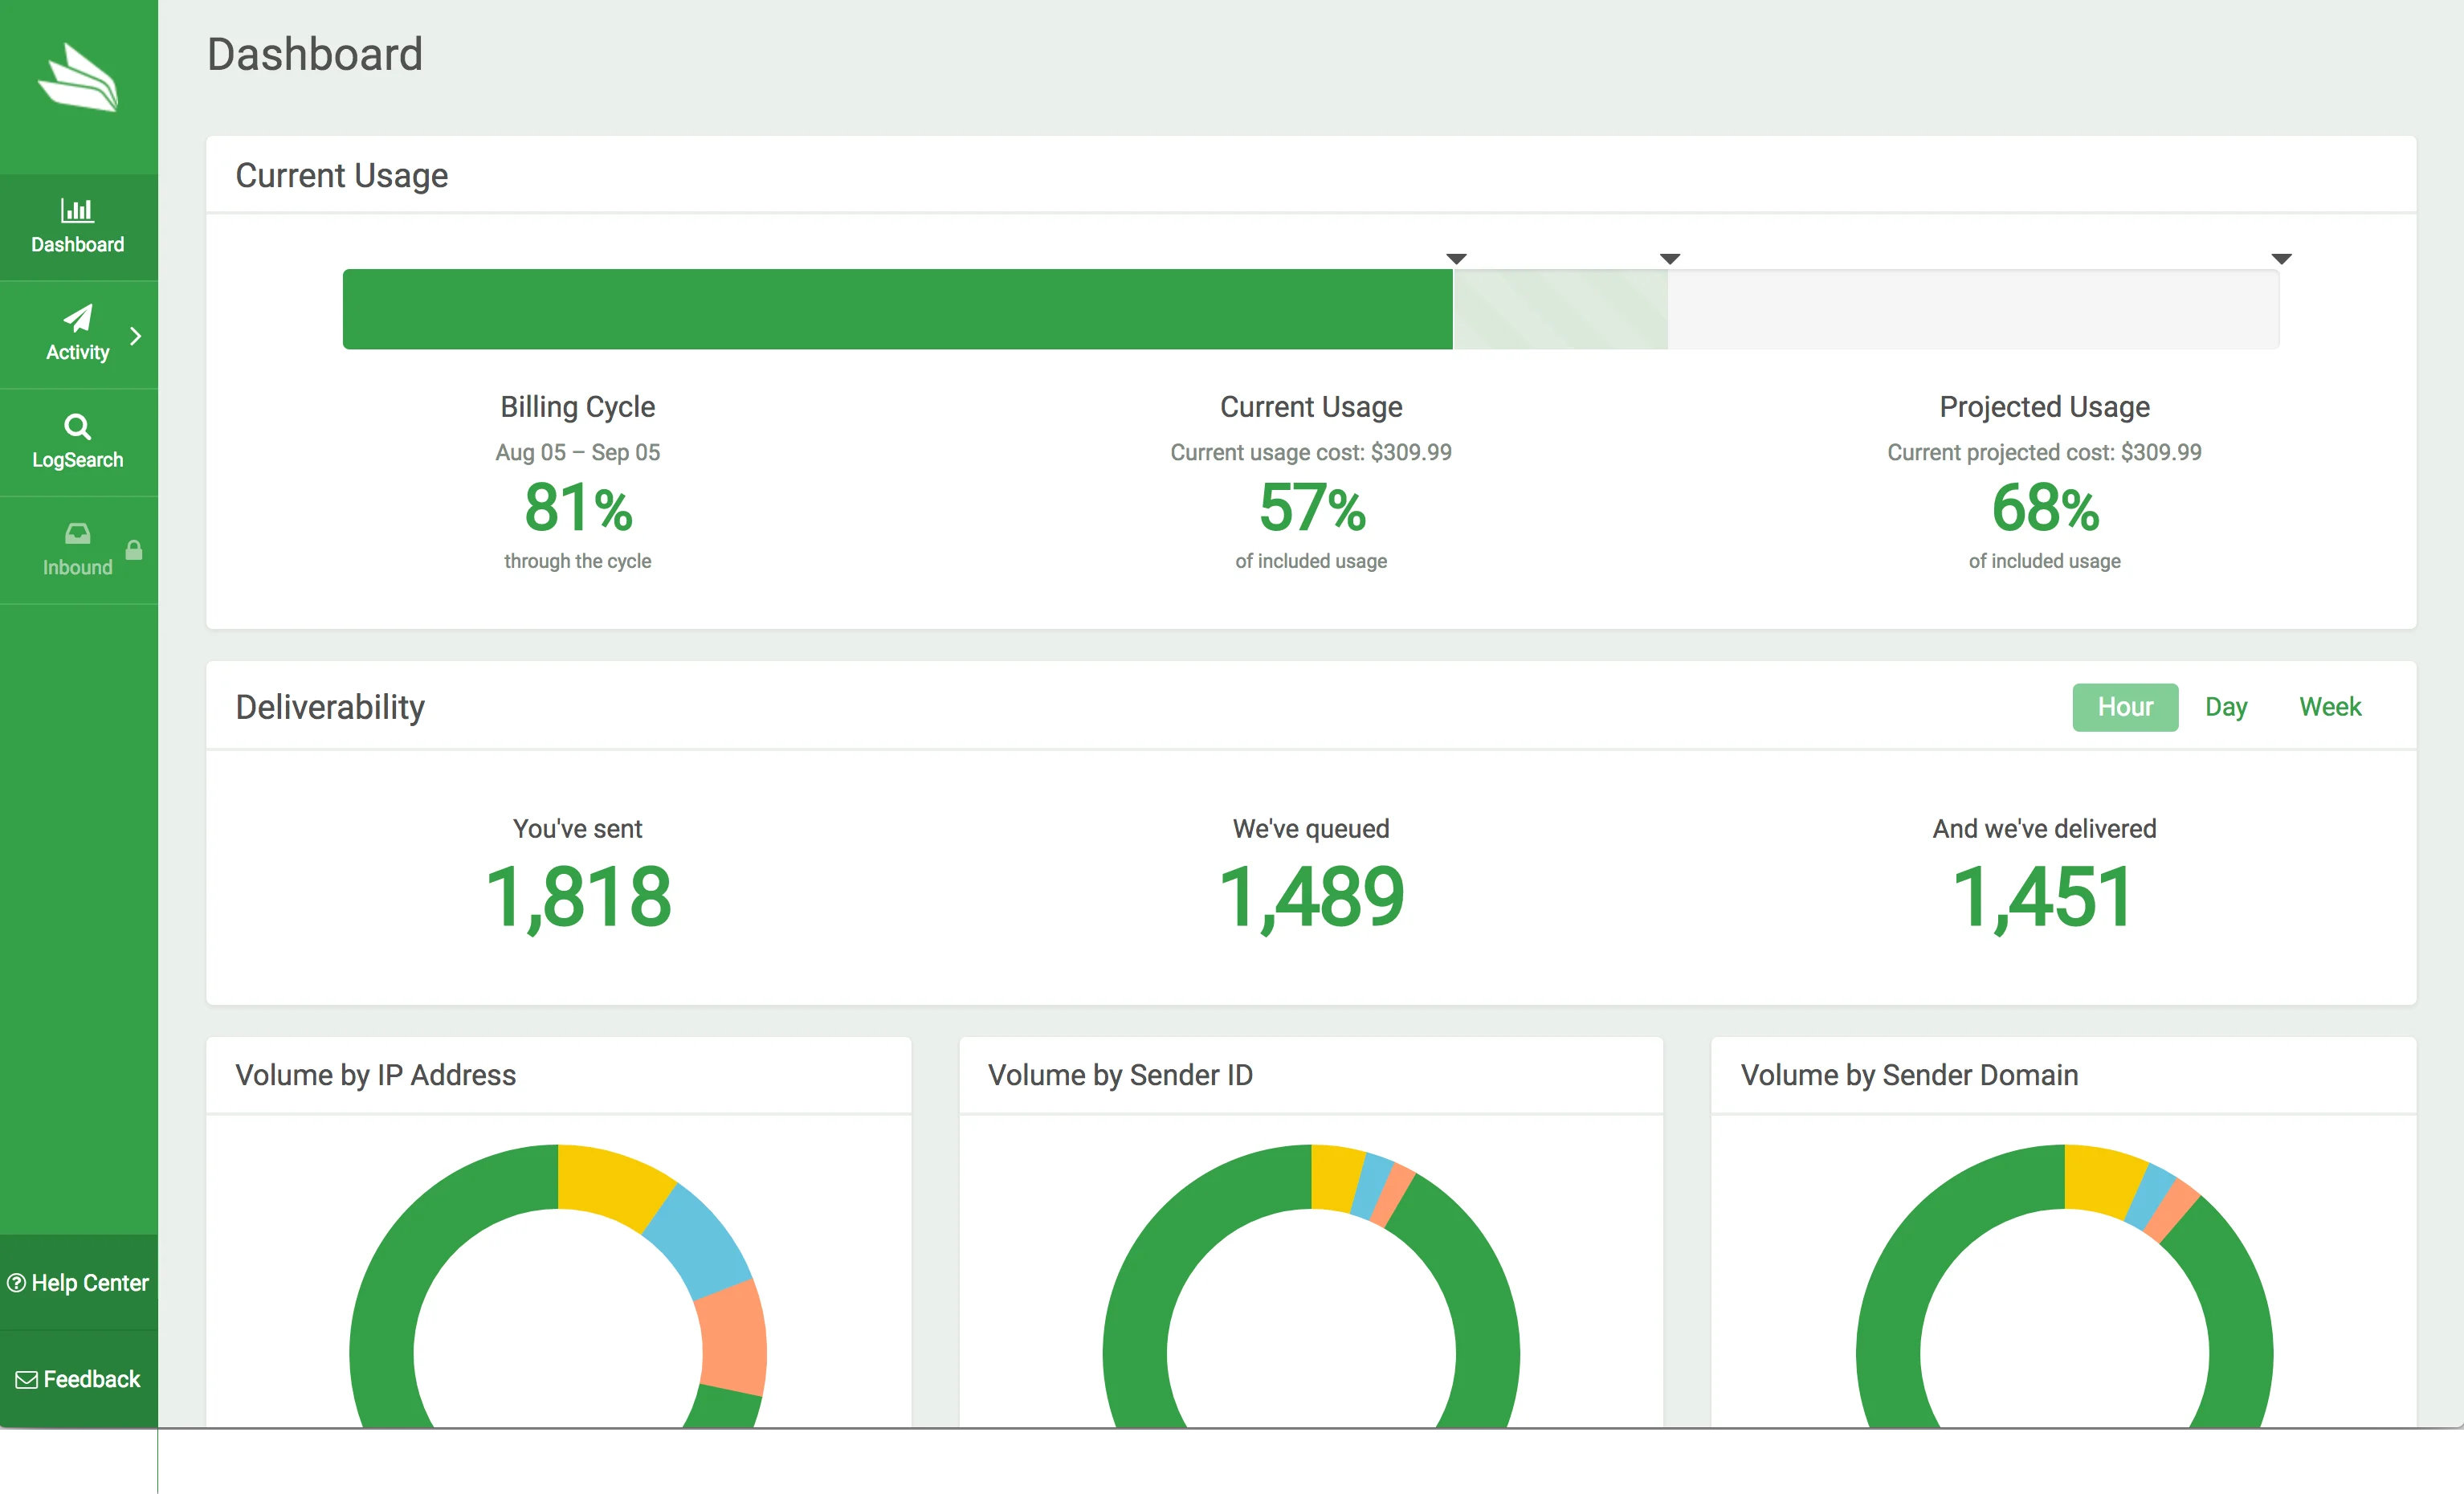
Current Usage
You can keep track of your current email usage and how many days are left in your billing cycle so there are no surprises on your next billing statement. The top row of cards displays the following:- Progress bar — a quick visual representation of how fast your monthly budget is being spent against the message limits of your subscription plan.
- Dark green represents email consumption for the current billing period.
- Light green represents the projected consumption.
- The entire progress bar represents 100% of your allotted emails per month.
- Billing Cycle — your billing cycle start and end dates, and your progress into the billing period as a percentage.
- Current Usage — the cost of your current usage and your progress through your subscription allowance as a percentage.
- Projected Usage — the cost of your projected usage including overages, and your projected overage progress as a percentage.
Deliverability
The Deliverability card is second from the top of the Dashboard and includes three columns:
The date range selector is at the top right of the Deliverability card. Select from the following predefined ranges: